Introduction
Regrow capitalizes on satellite remote sensing data to monitor agricultural practices globally, yet at fine enough spatial and temporal resolutions to monitor the management practices on each and every field. We currently monitor over 42 million fields and the count keeps growing! We primarily use data from the NASA/USGS Landsat missions and the ESA Sentinel missions to map the globe and rely on other governmental and private data sources when necessary to meet the needs of our customers and improve our products.
Field Boundaries
Agricultural parcels are delineated using a classical object-based approach which applies the Simple Non-Iterative Clustering (SNIC) algorithm to each image across a time series of satellite imagery. The use of multiple-year time series accounts for the historical record of management within the parcel. This enables delineation of what may appear to be a single parcel undergoing a single management regime in one-year, yet is bifurcated in other years with each segment undergoing different practices and management activities. This method errs on the side of over segmenting a field to ensure such management scenarios are properly captured. Regrow has delineated and implements over 42 million field boundaries across the globe. The table below provides the current number of fields by country.
|
Country |
Fields |
Average area (ha) |
Total Area (millions of ha) |
|
USA |
17,184,965 |
15.0 |
257.6 |
|
CAN |
5,880,419 |
20.2 |
118.6 |
|
DEU |
4,459,812 |
4.5 |
20.1 |
|
FRA |
4,434,767 |
7.0 |
31.1 |
|
GBR |
3,341,804 |
5.3 |
17.6 |
|
POL |
2,937,688 |
5.3 |
15.6 |
|
ROU |
1,834,475 |
7.1 |
13.1 |
|
IRL |
1,166,538 |
4.6 |
5.4 |
|
BEL |
257,582 |
6.0 |
1.5 |
|
NLD |
243,678 |
6.8 |
1.6 |
|
ESP |
189,100 |
11.4 |
2.1 |
|
ITA |
173,414 |
4.4 |
0.75 |
|
CHE |
126,826 |
3.3 |
0.41 |
|
LUX |
18,672 |
5.4 |
0.11 |
Commodity Crop Identification
Identification of crop types is performed by Regrow's CropID model; an advanced Deep Learning method that uses a Lightweight Temporal Attention Encoder architecture. The model is trained using a wide array of crop type data sourced from government agencies and partners. As these training data and their availability vary from place to place, the list of crop types identified by cropID also varies by country or region. See this page for available crop types by country.
CropID model predictions are validated against high quality data from growers, research partners & organizations, and government agencies.
Plant and Harvest Dates
Monitor relies on plant and harvest dates to construct a non-overlapping sequence of management practices for each and every field. A field’s plant and harvest dates are determined using a Lightweight Temporal Attention Encoder model; use of a common advanced model architecture for cropID and plant and harvest date prediction is a recent advancement in Regrow’s methods. The model uses training data that identifies dates of crop emergence and senescence which serve as proxies for planting and harvest dates. These dates provide critical information for crop growth and determine the weeks and months of the year in which we make determinations about tillage intensity and cover crop presence.
Plant and Harvest dates predicted by the model are validated against a hold out of the training data and are also compared to annual crop calendars provided by government agencies and partners, ensuring the model returns realistic dates by identifying outliers that don’t follow agronomic norms.
Cultivation Cycles
Previously, Regrow quantified emissions based on calendar year, ascribing all activities on a field in that year to a crop. Emissions quantification, including emissions factors, are now associated with a specific ‘cultivation cycle,’ as opposed to a full ‘crop year.’ This means that emissions for a given crop are ascribed to the period between the previous crop’s harvest and the harvest of the crop that is being measured (see visual diagram of change).

The ‘cultivation cycle’ approach is a more accurate agronomic representation of the emissions associated with rearing a given cash crop. This update aligns Regrow’s emissions factors more closely to LCA methodology specifications.
Specifically, we are now:
- More accurately identifying winter crops as cash crops as opposed to cover crops, which substantially reduces incidental over counting of cover crops
- More accurately calculating emissions on double cropping systems.
Cover cropping
Cover crops are non-commodity crops planted and grown in the periods between commodity crops. These are often the periods with the greatest temperature and moisture constraints on vegetation photosynthesis which can result in variable growth and cover due to seed type selection, planting method, failed or inadequate emergence, or weather constraints. Although the intent to grow a cover crop may be known (farmer reports planting a cover crop), the result of that intent (the cover crop's growth, field coverage, and duration) is what is tracked by the remote sensing data and Monitor. During this period we may also observe the growth of weeds or volunteer crops (that emerge from seeds remaining in the field); while there was no intention to grow a cover crop, green vegetation appears on the field. Those weeds or volunteer crops however generally do not reach equivalent levels of cover or greenness as an intentional cover crop nor do they reach equivalent greenness levels as compared to the natural surrounding herbaceous vegetation.
Regrow relies on a tried and true remote sensing index to estimate the coverage and greenness of cover crops during the non-commodity period. We use the Normalized Difference Vegetation Index which increases from 0 to 1 as the chlorophyll or photosynthetic potential (aka greenness) increases in the vegetation being observed. For every field we calculate monthly maximum NDVI during the non-commodity period (from the harvest of the previous crop to the planting of the next crop). The average of those monthly maximum values across the non-commodity period is then used to determine whether a cover crop was present on the field. We also calculate the NDVI of the natural herbaceous vegetation in the surrounding region during the same period, as this value is a key comparison point to determine if a ‘green’ field should be classified as cover crop or a potential cover crop.
Regrow uses three cover crop classes; no cover crop, cover crop, and potential cover crop that are assigned to a field based on its non-commodity period NDVI, and how that value compares to the NDVI of the surrounding herbaceous vegetation. We use two NDVI thresholds, NDVI < 0.3 and NDVI > 0.5, to clearly identify no cover crop and cover crop classes, respectively. If a field’s non-commodity mean NDVI value does not exceed 0.30 it is given a no cover crop classification - a common threshold to distinguish green vegetation from senescent vegetation or bare soil. If a field’s non-commodity mean NDVI value exceeds 0.5 it is classed as cover crop - an NDVI of 0.5 or greater is a level often achieved by commodity crops and a value generally not reached by weeds or volunteer crops. If a field's NDVI is between 0.3 and 0.5 additional criteria need to be met to get a cover crop classification, otherwise it is classified as potential cover crop. We use different thresholds for different regions of the world, given herbaceous vegetation levels differ regionally.
| Region | Cover Crop | Possible Cover Crop | No Cover Crop |
| US & Canada | NDVI > 0.36 | NDVI>0.3 & <0.36 | NDVI < 0.3 |
| France | NDVI > 0.49 | NDVI>0.3 & <0.49 | NDVI < 0.3 |
| Germany | NDVI > 0.49 | NDVI>0.3 & <0.49 | NDVI < 0.3 |
| Poland & Romania | NDVI > 0.36 | NDVI>0.3 & <0.36 | NDVI < 0.3 |
| UK & Ireland | NDVI > 0.49 | NDVI>0.3 & <0.49 | NDVI < 0.3 |
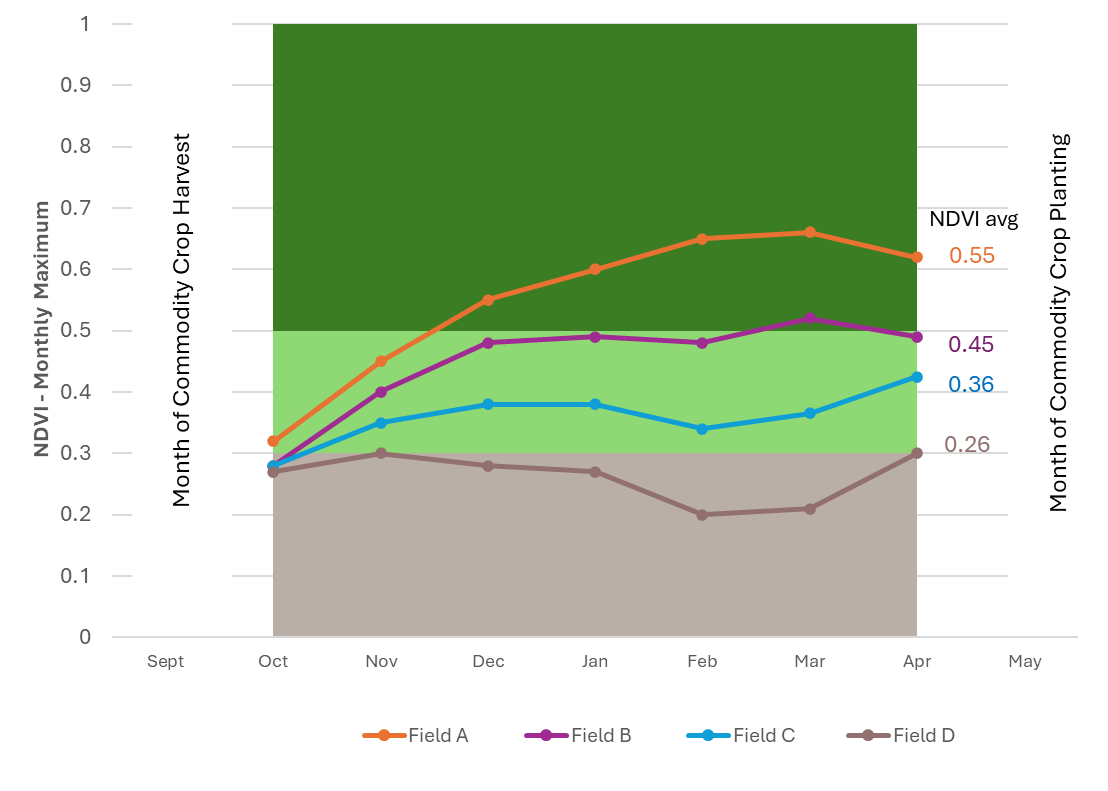
To receive a cover crop classification when a field’s NDVI is between 0.3 and 0.5, the value must meet or exceed the NDVI of the surrounding natural herbaceous vegetation. Consider the non-commodity NDVI time series of four fields displayed in the diagram below. Field A, with a non-commodity NDVI average of 0.55, will be classified as cover crop. Field D, with an non-commodity NDVI average of 0.26, will be classified as no cover crop. Field’s B and C classification however will depend on the NDVI of the regional herbaceous vegetation for the most recent few years. The table below displays the three possible scenarios for fields B and C.
|
Field non - commodity NDVI |
Regional herbaceous vegetation NDVI |
|||
|
0.32 |
0.40 |
0.49 |
||
|
Field B |
0.45 |
cover crop |
cover crop |
potential cover crop |
|
Field C |
0.36 |
cover crop |
potential cover crop |
potential cover crop |
In certain cases limited image availability prevents our ability to make a cover crop determination, which are referred to as 'unverified' acres.
Fields that are marked as fallow for that year and fields that grow perennials are marked as 'not applicable' for cover crop and not included in the cover crop adoption calculations.
Green Cover
Regrow uses an established remote sensing index, the Normalized Difference Vegetation Index, to estimate the greenness of a field during the non-commodity period. The NDVI increases from 0 to 1 as the chlorophyll or photosynthetic potential (aka greenness) increases in the vegetation being observed. For every field we calculate the monthly maximum NDVI during the non-commodity period (from the harvest of the previous crop to the planting of the next crop). The average of those monthly maximum values across the non-commodity period is then used to place that field into one of the four categories.
The NDVI bins applied here are:
|
NDVI |
Category |
|
0.0 - 0.3 |
No green cover |
|
0.3 - 0.4 |
Low green cover |
|
0.4 - 0.5 |
Moderate green cover |
|
0.5 - 1.0 |
High green cover |
The goal of this KPI is to enable a view of greenness intensity during non-commodity periods within a supply shed over time. These categories are calculated using the same NDVI values that inform our cover crop classification process. The categories also share similar NDVI thresholds so the acres of cover crop and no cover crop will correlate with acres in the high green cover and no green cover categories. Whereas all acres in the high green cover category will count as acres with a cover crop and all acres in the no green cover category will count as no cover crop acres. Acres in the low or medium cover categories may be counted as cover crop, but only if they meet regional NDVI thresholds that vary from year to year. For more detail, take a look at the details related to our Cover Crop metric.
Tillage
The identification of a field scale tillage event and its intensity is an ongoing challenge in the agricultural remote sensing science community. The best methodology thus far to identify tillage intensity at large spatial and temporal scales is to estimate the residue cover on the field post-harvest and pre-plant. The percent residue cover remaining on the field serves as a proxy for tillage intensity - which Regrow classifies into three categories of No tillage, Reduced tillage, and Conventional tillage following standard conventions of the USDA, other governmental organizations, and the peer-reviewed literature. Conservation tillage is further defined as the combined classifications of No tillage and Reduced tillage. If a field is not tilled following harvest the residue will often cover much of the soil surface (e.g. 60% of the field in residue heavy crops such as corn, or 30% for crops with highly fragile residues like soybeans). If a field is conventionally tilled however, the remaining residue will likely be much lower (e.g. 15% or less).
Regrow employs and builds on established methods from the peer-reviewed literature to estimate residue cover on a field. The algorithm calculates the Normalized Difference Tillage Index and remote sensing indices sensitive to soil and residue moisture to map estimates of residue cover at weekly intervals. The field’s plant and harvest dates are used to determine which weekly residue cover data are used to estimate tillage. Residue estimates won’t be accurate while there is a commodity crop or cover crop on the field and they will best represent tillage intensity when observed in close temporal proximity to the tillage event itself. As it is impossible to know the exact dates of tillage events across the 42 million fields we monitor, we examine the field 8 weeks following harvest and the 8 weeks prior to planting to make determinations about tillage intensity. During those two 8 week periods we use the residue cover estimates we have the most confidence in to estimate tillage intensity. Confidence is based on the extent of field observed (often cloud cover obscures part or all of the field), and the variability of the residue cover estimates across the field; with higher confidence given to observations that cover a majority of the field and are less variable across the field.
Tillage intensities are then determined for the field based on the two residue cover estimates, one from the 8-weeks following harvest of the previous crop and one from the 8-weeks prior to the plant of the current crop. As mentioned the residue cover is not only based on tillage intensity but also on the characteristics of that residue; is it dense and non-fragile residue such as corn? or is it a fragile residue such as soybean or cotton? To account for this Monitor currently uses two sets of thresholds to translate the residue cover to tillage intensity; one for fragile crops and another for non-fragile crops (sample table below).
|
Conventional Till |
Reduced Till |
No Till |
|
|
Fragile crops residue cover |
0% - 15% |
15% - 30% |
30% - 100% |
|
Non-fragile crops residue cover |
0% - 30% |
30% - 60% |
60% - 100% |
In certain cases limited image availability prevents our ability to make a tillage determination, which are referred to as 'unverified' acres.
Fertilizer application
- Definition: a substance containing one or more recognized plant nutrients applied to crops to provide a production benefit, where the production benefits should exceed any temporary negative impact on soil biology
- KPI value(s): rolling 5 year average of fertilizer application (KG/acre) per each geospatial aggregation unit broken down by N, P, K, S.
- Metric calculation details: Regrow conflates multiple data sources (i.e. USDA NASS survey information, data from literature review, primary farm data) to determine the an average application per crop per growing season.
Crop rotation
- Definition: an agriculture practice alternating the types of crops that are grown in the same place with the aim to improve the efficiency of the crops, minimize soil wear and control the development of diseases and pests.
- KPI value(s):
- The average number of seasonal crop rotations year over year for a given historical time series weighted by field area.
- The most common crop rotations per geospatial unit weighted by field area.
- The average number of fallow rotations year over year for a given historical time series weighted by field area.
- Metric calculation details: a temporal crop rotation sequence analysis for each field segment considering the frequency of the most common crop, number of possible annual rotations over the entire historical time series and frequency that cover crops were planted between cash crops.
MonitorML
Regrow’s Monitor is a geospatial software and analysis system that captures and reports the complete sequence of agricultural practices over any agricultural field across a single year or multiple years. Monitor reads, analyzes, and interprets geospatial rasters produced by Regrow’s Data Science team, calculates field-scale statistics, and translates those data of crop identification, plant and harvest dates, and biophysical field attributes (e.g. greenness, residue cover) into a series of agricultural practices. For example, for each field boundary and crop year, Monitor determines the crop type and its plant and harvest dates, the presence or absence of a cover crop during the non-commodity crop season, and a tillage intensity using residue cover estimates calculated between the harvest of the previous crop to the planting of the subsequent crop.
Learn more about Monitor ML here.