![Regrow_logo-1.png]](https://help.regrow.ag/hs-fs/hubfs/03.%20Logos/Regrow_logo-1.png?height=40&name=Regrow_logo-1.png)
Introduction
In 2026, Regrow Ag continued its monitoring and emissions reporting expansion across Europe with the launch of Sustainability Insights (SI) for Sweden and Finland. This release offers our customers greater precision in making informed Scope 3 investment decisions and reporting on Scope 3 emissions outcomes across Swedish and Finnish supply sheds.
In preparation for this release, Regrow made region-specific investments to support Sweden and Finland by expanding ground-truth data coverage for the Nordics using Swedish and Finnish government agricultural data, and training our crop detection models specifically for these two countries. This region-specific work ensures that Regrow's solutions can reliably monitor agricultural practices and model emissions outcomes on the field across Sweden and Finland.
What's New
This release brings Regrow's Sustainability Insights to Sweden and Finland for the first time. With this launch, customers can access the full range of SI reporting and planning capabilities across their Swedish and Finnish supply sheds, including:
- Monitor KPIs — crop type and management practice data derived from remote sensing
- On field emissions — baseline, field-level GHG emissions and soil organic carbon change (dSOC)
- Farmgate emissions — crop- and activity-level emission factors for emissions categories upstream of the field.
- Plan module — investment and scenario planning to evaluate practice-change interventions and MRV ROI
- *Note on interventions: Plan does not support combined tillage reduction and nitrogen reduction interventions for Sweden and Finland, as these are not commonly agronomically viable in these regions. Plan still supports all other cover crop/tillage and nitrogen interventions.
- Climate risk data – Temperature anomaly & heat, drought, precipitation and erosion insights
- Statistical land use change (sLUC) emissions – LSRS aligned emissions from deforestation conversions
This release is powered by:
- New CropID crop detection models trained specifically for Sweden and Finland
- New Parcel ID field-boundary delineation for the region
- Remote sensing practice detection, including tillage, cover crop, and crop type
- DNDC biogeochemical modeling for field-level emissions
Remote Sensing and Monitor Model Updates
Crop Detection
CropID is Regrow's machine learning crop detection model, built on remote sensing technology. It uses remote sensing data to predict crop type as well as planting and harvest dates.
For the Sweden and Finland release, CropID models were trained and validated specifically for these two countries using ground truth from Swedish and Finnish government agricultural data. This region-specific training allows us to provide high quality classification, especially in the crops most relevant to our customers. As we incorporate more data inputs, we continuously refine our models to provide targeted insights and emissions impact data, ensuring our customers receive the most relevant and up-to-date information.
For more on how Regrow detects crop type and management practices from remote sensing, see Remote sensing practice detection technology.
Supported Crops
The following crops are supported in Sustainability Insights for Sweden and Finland:
|
Crop |
SI Availability |
|---|---|
|
Barley |
Report & Plan |
|
Canola (Rapeseed) |
Report & Plan |
|
Fallow |
Report Data Only |
|
Oats |
Report & Plan |
|
Peas |
Report & Plan |
|
Potatoes |
Report & Plan |
|
Rye |
Report Data Only |
|
Sugar Beets |
Report & Plan |
|
Spring Wheat |
Report & Plan |
|
Winter Wheat |
Report & Plan |
A field's history may still include crops beyond this list, but the reporting and planning views in Sustainability Insights are limited to the supported crops above.
Field Delineation
Delineated field boundaries that represent crop land are essential parameters for remote sensing, and serve as the basis for DNDC to quantify emissions of an area.
Regrow uses an in-house field delineation model called Parcel ID, which identifies and outlines field boundaries for the region. Fit-for-purpose agricultural field boundaries are important for evaluating key performance indicators, baseline emissions, and abatement potential in SI. Parcel ID uses satellite imagery to delineate agricultural field boundaries, improving the accuracy of covered-area identification and the exclusion of non-agricultural land.
For more information, see Parcel ID: Regrow's field delineation algorithm.
Cover Crop Classification
Regrow's cover crop classification methodology uses a dynamic time window based on commodity crop planting and harvest and geographically specific thresholds that reflect climate variability, allowing for the assessment of cover crop presence at any time when no commodity crop is present on the field. This dynamic approach enables the detection of cover crops, including winter commodity systems.
The thresholds for cover crop presence are set dynamically based on regional greenness, which is specific to the region within each country and reflects local climate variability.
- Minimum of 8 weeks required between main commodity crop harvest and the following crop planting to make a green cover determination
- This results in green cover determinations that exclude volunteers, weeds, and short-lived commodity re-growth as possible cover crops
- Regional greenness thresholds are used to inform the cover crop determination. In practice this means that in order for a determination of cover crop to be made, the field must have enough living vegetation to cover the soil for the majority of the cover cropping period.
- This means that colder regions where there is less green cover may have lower greenness thresholds for classifying a cover crop.
Tillage Classification
Conservation tillage is defined as having a minimum of 30% remaining crop residue on a field after a tillage event. This definition aligns with accepted global definitions of conservation tillage, defined by leaving at least 30% crop residue or more on the field. By aligning our classifications to observed residue cover, the result is a more conservative account of tillage practices that removes the ambiguity in tillage intensity definition.
|
Regrow's Classification |
|
|---|---|
|
Conventional Till |
<30% residue cover |
|
Reduced Till |
30% residue cover |
|
Conservation Tillage |
30% residue cover (equivalent to reduced tillage) |
|
Conservation Till / No Till |
60% residue cover |
Cultivation Cycles
With the expansion into Europe, Sustainability Insights uses a cultivation cycle reporting methodology. A cultivation cycle spans from the harvest of one commodity crop until the harvest of the next commodity crop. All practices that happened within this time period (after harvest of the preceding crop and in preparation for planting of the crop of interest) are associated with the crop of interest. All outcomes are reported in the year the crop is harvested.
What data validation framework does Regrow use for crop and practice determination models?
- Crop type models are trained on public data, and validated on high quality data from growers, customers, and other 3rd party partners.
- Practice models are calibrated and tested at the field level using data from research partners & organizations, growers, and other 3rd party partners. We also compare our aggregate data to publicly reported data in EuroStat (e.g., NUTS 2 regional stats).
Emissions and DNDC Modeling
Regrow's Denitrification-Decomposition (DNDC) model is a biogeochemical model that estimates nutrient cycling in soil and GHG emissions, considering changes from farming practices. It supports over 100 crop types and has been validated by more than 500 scientific peer reviews. DNDC is calibrated for each crop, field, and region by sourcing the best available emissions data for specific crop and geographic combinations.
For the Sweden and Finland release, DNDC is used to:
- Quantify baseline, field-level emissions — soil direct N2O, soil indirect N2O, soil CH4, and soil organic carbon change (dSOC)
- Model practice-change interventions (counterfactuals) that power the Plan module, including reduced nitrogen, cover cropping, reduced tillage, and no-till scenarios
- Generate farmgate emission factors by crop and activity
CO2 Conversion Factors
For converting N2O and CH4 to CO2 equivalents, Regrow uses the conversion factors published in the 2021 IPCC Report (AR6).
|
Version |
N2O Multiplier |
CH4 Multiplier |
|---|---|---|
|
AR5 |
44 / 28 * 265 = 416.429 |
16 / 12 * 28 = 37.33 |
|
AR6 |
44 / 28 * 273 = 429 |
16 / 12 * 29.8 = 39.733 |
Detailed values for AR6 can be found in Table 7.15 of the IPCC Technical Report, found here.
Impact of Weather on Outcomes
Weather is a primary driver of year-to-year variability in the modeled emissions for both Sweden and Finland. Across the fields modeled in these geographies, 2023 stands out as a notably cold and wet year. In Finland, 2023 recorded the highest number of days with daily minimum temperatures below 0°C and the highest total annual precipitation of the 2019–2025 period. In Sweden, total annual precipitation surged to its highest level in 2023 and remained elevated through 2024, coinciding with the highest modeled GHG emissions in Sweden across the same period.
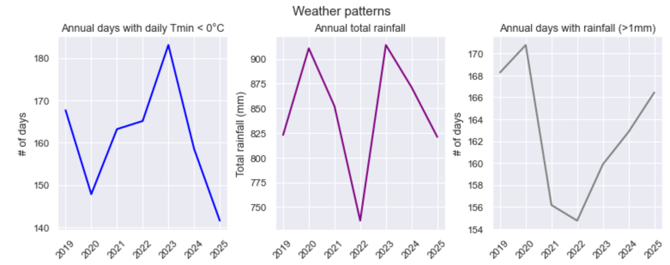
These patterns are consistent with the underlying soil biogeochemistry. High amounts of rainfall can lead to increased nitrification and denitrification processes due to higher soil moisture content, and heavy precipitation can increase the chances of nitrogen leaching, driving both direct and indirect N2O emissions. Days with minimum temperatures below 0°C also increase the likelihood of freeze-thaw cycles, which can produce emissions fluxes as soils thaw.
As for dSOC, we would ideally like to see values in the negatives to indicate yearly sequestration. However, that is not currently the case in these datasets, likely for a few reasons:
- Regrow's remote sensing practice detection indicates very low cover crop adoption across the modeled fields in both countries — for the majority of years, well over 95% of fields were modeled without a cover crop — while conventional tillage remained the dominant practice (reaching approximately 78% of modeled area in Finland and approximately 60% in Sweden in their respective peak years).
- With limited cover cropping and a majority of conventional tillage, it is not surprising that we see a loss in SOC over the years across large geographic areas. Soil characteristics and climate zones vary considerably within each country, so results at the regional level can differ meaningfully from the national picture.
Quality Control and Assurance
Monitor Sustainability Insights QA
The primary aim of Monitor Sustainability Insights (SI) QA is to discover errors or problems in the modeled agronomic logic, so that solutions can be implemented before finalized data production. Additionally, it sheds light on assessment of the overall quality of the data in terms of alignment with reasonable cropping practices, temporal expectations of those practices, and regional-scale reports of practice adoption. Monitor SI QA is conducted on 1) Monitor results, aggregated with SI logic, to check for data validity and 2) Monitor results, aggregated with SI logic, as compared to reference data. The process consists of metrics, reporting, and analysis aggregated over time and geographic extent to check for valid data generation results. The QA process ensures data completeness by analyzing error rates, cropping period consistencies, and practice distributions. The concepts checked for data validity include:
- Measurement of return rate of associated field data over the supported time period
- Alignment of agronomic expectations for cropping period time windows
- Assessment of spatiotemporal distribution of management practices and crop types
DNDC QA
The primary goal of DNDC SI QA is to identify abnormal values or outliers in our modeled GHG results that may indicate errors or problems within the model or input generation pipeline itself. DNDC SI QA aims to validate the GHG and EF numbers that are produced using a large suite of peer reviewed studies and LCA/EF databases. When conducting QA on the DNDC produced GHG values, data is aggregated such that results can be assessed on a country, regional, and crop level. EFs are also aggregated in a similar fashion such that we can validate them against our known data sources. Validating data includes ensuring that GHG values are within reasonable bounds for individual emissions (SOC, N2O, and CH4) defined by a collection of peer reviewed studies and their corresponding in situ measurements. Similarly, crop EFs are validated by comparing values with Quantis data. If outliers are identified at either phase of QA, DNDC inputs such as weather, soil texture, fertilizer amounts, and crop rotations will be investigated to identify a reasonable explanation for the outlier or identify a problem within the model itself.