Overview
Regrow provides climate risk insights to help companies meet climate risk disclosure requirements under the Corporate Sustainability Reporting Directive (CSRD). These insights are integrated into the Sustainability Insights (SI) platform and help quantify historical drought trends across customer-defined sourcing regions and crops.
Drought
1. What We Measure
We use the Standardized Precipitation Index (SPI), a globally recognized indicator of drought, derived from historical precipitation data. SPI measures how dry a region was in a given year compared to its long-term average. The more negative the SPI value, the more intense the drought.
To make this actionable, we classify SPI into discrete drought severity scores, using the US Drought Monitor’s approach:
|
SPI Range |
Drought Category |
Drought Score |
|---|---|---|
|
≥ -0.49 |
No drought / wet |
No Risk |
|
-0.5 to -0.79 |
Abnormally dry |
D0 |
|
-0.8 to -1.29 |
Moderate drought |
D1 |
|
-1.3 to -1.59 |
Severe drought |
D2 |
|
-1.6 to -1.99 |
Extreme drought |
D3 |
|
≤ -2.0 |
Exceptional drought |
D4 |
2. Where We Measure
We currently support drought risk insights globally with a mix of spatial resolution from field-level and crop-specific insights to regional crop-agnostic insights.
Support for broader field-level resolution is planned for future releases.
3. When We Measure
-
Drought scores are provided annually for each region.
-
Current coverage spans 2014 through 2024, enabling customers to analyze drought trends and persistence over time.
-
Scores are aligned to the calendar year (Jan–Dec) to match typical corporate reporting cycles.
4. How We Measure
Drought scores are calculated at two levels of resolution:
Global Resolution (Regional View)
-
Based on a 0.25° x 0.25° grid (~180,000 acres per cell)
-
Available globally
-
Provides a drought score for any subregion, regardless of size, crop or field boundaries
Field-Level Resolution (Crop-Specific View)
-
Uses Regrow’s delineated field boundaries
-
Where available, we calculate drought scores per field, then aggregate those scores only for fields growing a specific crop, such as barley
-
This allows you to understand how drought specifically affects your crops within a sourcing region
5. How We Aggregate Risk
Depending on the resolution:
-
Global scores are averaged across all grid cells in a region
-
Field-level scores are averaged using a cropland area-weighted approach, so larger fields have more influence in the final score
∑n fields (SPI * field area) / ∑n fields (field area)
We never mix global and field-level data in a single calculation to ensure accuracy and avoid over-representing certain areas.
6. How You’ll See This in Sustainability Insights
In the Spatial Exploration tool and Reporting modules, you’ll see:
-
Annual drought scores for each sourcing region.

-
A visual map overlay that highlights the severity of drought across your regions of interest.

-
An excel spreadsheet that includes the annual drought score for each supply shed or subregion (depending on your selection of aggregation at the time of the export).
Temperature & Heat
1. What We Measure
Temperature
We report two temperature indicators derived from daily observations:
-
Annual Mean Temperature (°C): The average daily temperature across the year.
-
Annual Mean Maximum Temperature (°C): The average of daily maximum temperatures across the year.
- YoY Temperature Change (°C): The change in average daily temperature from one year to the next.
These indicators provide a clear picture of overall warming trends and the prevalence of extreme heat days. Temperature rasters were derived from the .1° resolution ERA5-Land post-processed daily statistics dataset.
Heat Stress
We also measure heat stress using the Universal Thermal Climate Index (UTCI), a “real feel” indicator that incorporates humidity, wind, and radiation into temperature. From this, we report:
| UTCI (°C) | Thermal Stress Category |
|---|---|
| > 46 | Extreme heat stress |
| 38 – 46 | Very strong heat stress |
| 32 – 38 | Strong heat stress |
| 26 – 32 | Moderate heat stress |
| 9 – 26 | No thermal stress |
Two annual heat metrics are provided:
-
Heat Stress Days: Number of days where UTCI exceeds 40°C.
-
Heatwave Events: Number of periods with two or more consecutive days of UTCI over 40°C.
2. Where We Measure
We currently support temperature and heat risk insights globally with a mix of spatial resolution from field-level and crop-specific insights to regional crop-agnostic insights.
Support for broader field-level resolution is planned for future releases.
3. When We Measure
-
Metrics are reported annually for each region.
-
Current coverage spans 2014 through 2024, allowing customers to analyze trends over the past decade.
-
Scores align with the calendar year (Jan–Dec) to fit common corporate reporting cycles.
4. How We Measure
Heat and temperature metrics are calculated at two levels of resolution:
Global Resolution (Regional View)
-
Temperature data: Fine resolution (0.1° x 0.1° grid, ~11km²)
-
Heat stress data: Moderate resolution (0.25° x 0.25° grid, ~25km²)
-
Provides regional indicators for any customer-defined supply shed or subregion.
Field-Level Resolution (Crop-Specific View)
-
Uses Regrow’s delineated field boundaries (parcels).
-
Metrics are calculated for individual fields and aggregated across fields growing a specific crop (e.g., barley) in the region.
-
Enables insights into how extreme heat impacts specific crops and fields.
5. How We Aggregate Risk
Depending on the resolution:
-
Global metrics: Averaged across all grid cells within the selected region.
-
Field-level metrics: Aggregated using a cropland area-weighted average for more crop-relevant insights.
We avoid mixing global and field-level data in a single calculation to maintain data integrity.
6. How You’ll See This in Sustainability Insights
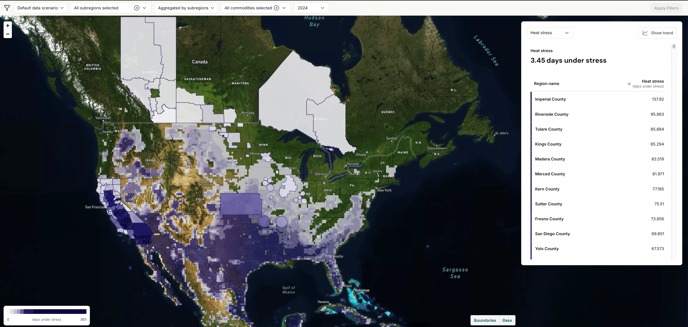
In the Spatial Exploration tool and Reporting modules, you’ll see:
-
Annual temperature and heat scores for each sourcing region.
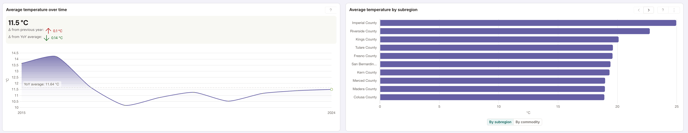
-
Spatial Exploration maps highlighting severity and trends
- An excel spreadsheet that includes the annual drought score for each supply shed or subregion (depending on your selection of aggregation at the time of the export).
Known Limitations & What’s Next
-
Crop-specific insights are only available where Regrow has both field boundaries and crop classification data
-
Climate scores reflect historical risk only – forecasts and future scenarios are not included in this release
-
Global scores do not reflect crop presence or specific field activity
We’re actively working to expand this product’s value and coverage:
-
New countries in the agriculture supply chain to provide more field-level visibility (e.g., Brazil, Australia, Argentina)
-
Support for other CSRD-relevant risk categories, such as biodiversity, water scarcity, and land use change
- Future yield modeling based on different IPCC scenarios for the short- and medium- term
Summary
Regrow’s climate risk insights allow you to identify climate exposure across your supply chain and meet regulatory requirements with confidence. Our data is science-based, geographically precise, and scalable across commodities, crops, and geographies.
Have questions or need help interpreting your drought scores? Please reach out to your Account Manager.